Graphene Oxide (GO)
Overview
Graphene oxide (GO) is a highly oxidized derivative of graphene, characterized by its significant oxygen content and excellent dispersibility in water and various organic solvents. It serves as a versatile precursor for the production of graphene-based materials and nanocomposites due to its rich surface functional groups.
Production Technique
The production of graphene oxide is primarily achieved through the chemical oxidation and exfoliation of graphite. We utilize the modified Hummers' method, which ensures a high degree of oxidation and provides stable, water-dispersible GO sheets with controlled layer thickness.
Standard batch capacities are available from 1 to 10 grams.
Pricing
| Quantity | Price (EUR, Tax not included.) |
|---|---|
| 1 g | 130 € |
| 2 g | 210 € |
| 5 g | 420 € |
| 10 g | 670 € |
Characterization data for the produced GO, including detailed interpretation of the results, is available with additional charges.
For up to date prices, request a quote.
Characterization
SEM Analysis
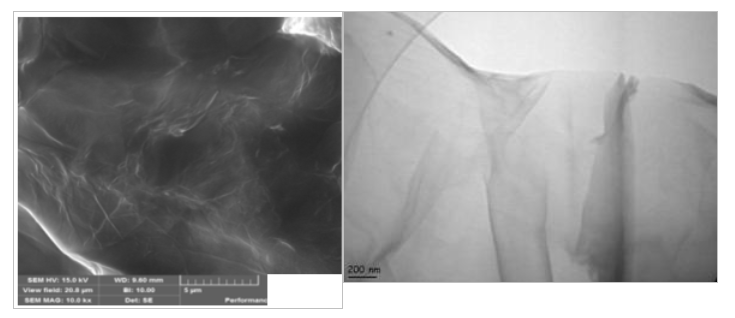
Scanning electron microscopy (SEM) and transmission electron microscopy (TEM) images of Graphene Oxide (GO) nanoparticles, synthesized via the optimized Hummers' method, reveal a transparent, cloud-like, brittle, and wrinkled planar structure. This morphology, consistent with one or a few layers, clearly demonstrates the successful exfoliation and high degree of oxidation characteristic of high-quality GO.
Infrared Spectra
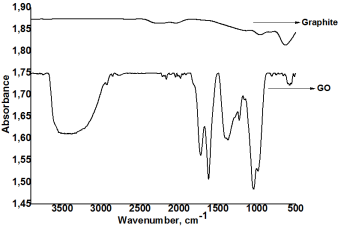
The infrared spectra of graphite and graphene oxide highlight the presence of key functional groups. The GO spectrum displays distinct absorption bands at 3350 cm⁻¹, 1740 cm⁻¹, 1622 cm⁻¹, 1168 cm⁻¹, and 1030 cm⁻¹. Notably, the characteristic C=O (-COOH) stretching vibration at 1740 cm⁻¹ and –OH stretching at 3350 cm⁻¹ confirm the successful synthesis of graphene oxide, while the peak in the 950–1050 cm⁻¹ range corresponds to symmetric C-O-C stretching.
Raman Spectrum
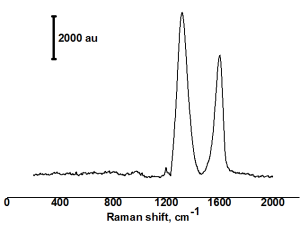
The Raman spectrum of the synthesized graphene oxide exhibits characteristic Raman-active D and G bands. These peaks appear at approximately 1320 cm⁻¹ and 1599 cm⁻¹, respectively, providing insight into the structural disorder and defects within the graphene oxide lattice.
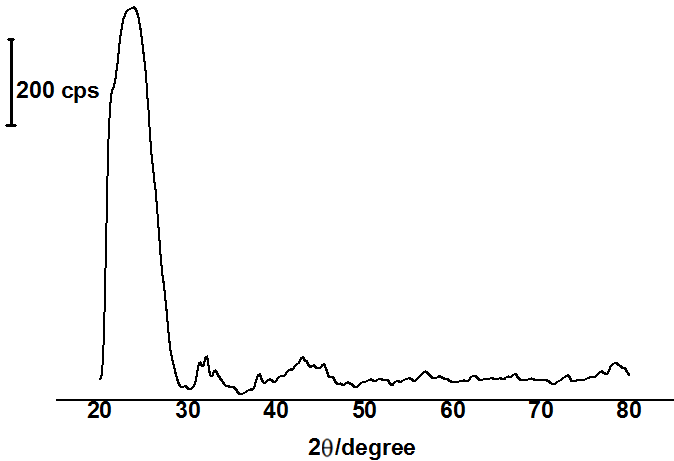
XRD Analysis
The X-ray diffraction (XRD) pattern of graphene oxide exhibits a broad peak at approximately 24°, which corresponds to the basal planes (c-axis) of the carbon structure. Rietveld refinement analysis determines a characteristic interplanar distance of approximately 4–6 nm, confirming the carbon symmetry of the material. Additional minor peaks present in the pattern are attributed to variations in orientation caused by hydroxyl and carboxyl group interactions within the hexagonal lattice along the c-axis.